What is a digital marketing metric or KPI?
KPIs, or Key Performance Indicators, are the critical metrics that successful brands use to measure their results.
Each KPI is intended to measure something specific and objective, to make it easy and useful to compare results over time and to competitors.
Ecommerce companies create marketing metrics with goals for KPIs and a plan to achieve each one. They execute the plan, review the results, adjust, and then iterate in a constant cycle of continuous marketing improvement.
Why You Should Use Marketing Metrics To Track Marketing Performance
![]() Marketing KPIs are a best practice to get more customers and grow revenue.
Marketing KPIs are a best practice to get more customers and grow revenue.
Measuring performance with objective marketing metrics can be the difference between stagnating revenue and successfully scaling your brand with paid advertising.
Having a strategy to improve marketing and scale ad spend makes it easier to focus on the things that matter, and make marketing decisions without guesswork. Without KPIs, it can be easy to get distracted by shiny new marketing ideas or contractors and lose touch with your goals.
Marketing KPIs can be used to objectively compare historical, present, and future (goal) performance in order to see if your marketing strategies are working.
What marketing metrics should your ecommerce business track?
This is a great question. There is no shortage of KPIs or metrics you might use to track your marketing performance.
The more common (and most useful) ones are typically Cost Per Lead (CPL), Cost Per Customer Acquisition (CAC), Return On Ad Spend (ROAS), and Customer Lifetime Value (LTV).
Cost Per Lead (CPL)
Cost Per Lead is often considered a “critical” KPI, especially for media buyers. They tend to focus on this because it’s a metric that can be easily tracked. It’s essentially just your total ad spend divided by the number of leads acquired. This can be calculated at channel, campaign or even ad level to evaluate performance.

The weakness of relying on CPL as a primary metric is that it isn’t always correlated with revenue. Lower CPL doesn’t always get you higher revenue (in fact, it often doesn’t).
There is a sweet spot when it comes to CPL that puts you in between many, super inexpensive leads that won’t convert and unaffordable leads that will convert but not bring in enough revenue.

A good media buyer will be able to help you land in that area, usually through a healthy ad testing budget and some trial-and-error.
Having accurate, multi-touch marketing attribution data is key to getting the long-term performance that your business needs to grow.
Cost Per Customer Acquisition (CAC)
 CAC is arguably the most useful marketing metric for paid advertising performance. This is going to tell you how much on average you are spending to bring in a customer using paid advertising, a particular channel, or campaign.
You can calculate CAC by adding up your total ad spend (per channel, campaign, or whatever level you are trying to measure) and dividing by the number of customers attributed to the same.

Like CPL, lowering CAC isn’t always going to get you better results. You might be bringing in more first time customers, but spending more overall because those customers aren’t high value, repeat buyers.
Focusing on high LTV customers and not just CAC, especially for cold traffic, will get you the best possible paid advertising results.
Return On Ad Spend (ROAS)
ROAS is often the top metric that media buyers use to demonstrate their performance.
It is calculated by totaling the ad spend and dividing by the total revenue attributed to that ad spend.

 There’s two issues that often come up with using ROAS as a performance indicator:
- ROAS is often calculated directly from the Ad Manager. Ad Manager often is wrong when accounting for revenue especially. You need to ensure your revenue attribution is correct when calculating ROAS.
- ROAS takes time to build. Inexperienced media buyers will often turn ads off before they have a chance to develop positive ROAS.
If you’re using ROAS, make sure your data is accurate and you’ve given the campaign at least one buying cycle to perform.
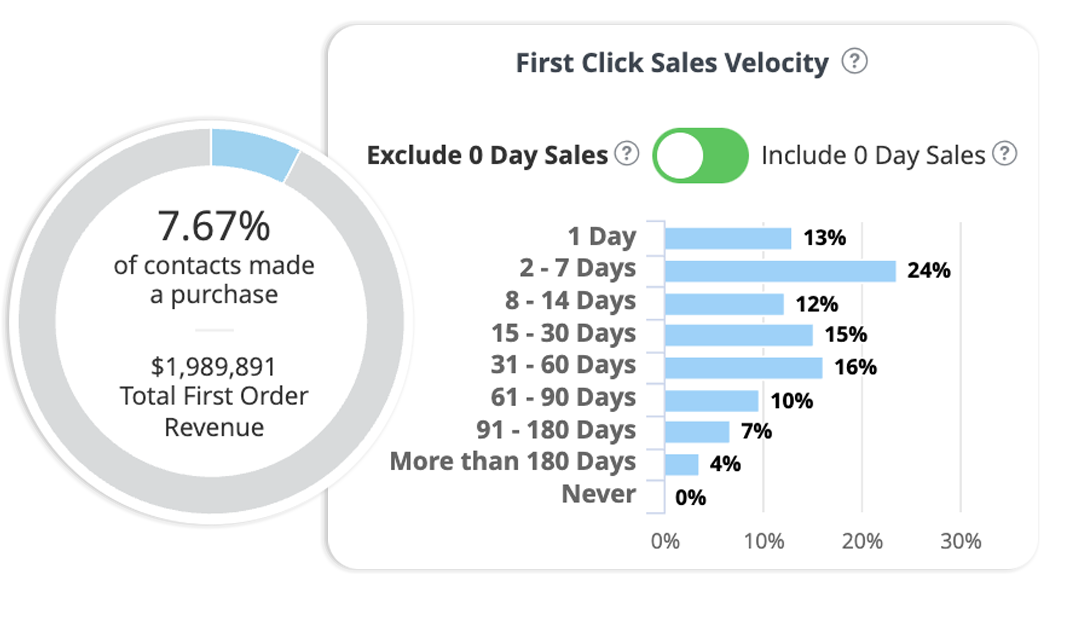
Not sure how long your brand's buying cycle is? Wicked Reports has you covered with our First Click Sales Velocity Report.

Use this report to easily identify how long customers take to convert after their first click interaction with your brand. We make it easy!
Return On Investment (ROI)
The main difference between Return On Investment (ROI) and ROAS is that ROI is calculated using only profit and includes all costs associated with a paid advertising campaign, including ad spend, agency fees, content creation, and operating costs.

ROI is better for an overall view of your paid advertising performance, whereas ROAS is better for zooming in to look at a particular ad platform or campaign.
Customer Lifetime Value (LTV)
At Wicked Reports, we consider customer LTV to be like a secret weapon KPI. Chances are, your competitors aren’t tracking their customer LTV and that gives you a huge opportunity.
LTV is all about bringing in the right customers, the ones who love your product and buy over and over again. This means that their value is increasing over time, instead of one-time buyers who never build value.
LTV can be calculated for individual customers by adding up your total revenue for that customer. Or, more helpful, is to add up your total revenue over a particular time period and then divide by the total number or new customers acquired.

You can see how this would be challenging to calculate using ad manager, because you cannot track individual customers. It would be impossible to tell what your new customer LTV is or what the LTV for a particular time period is.
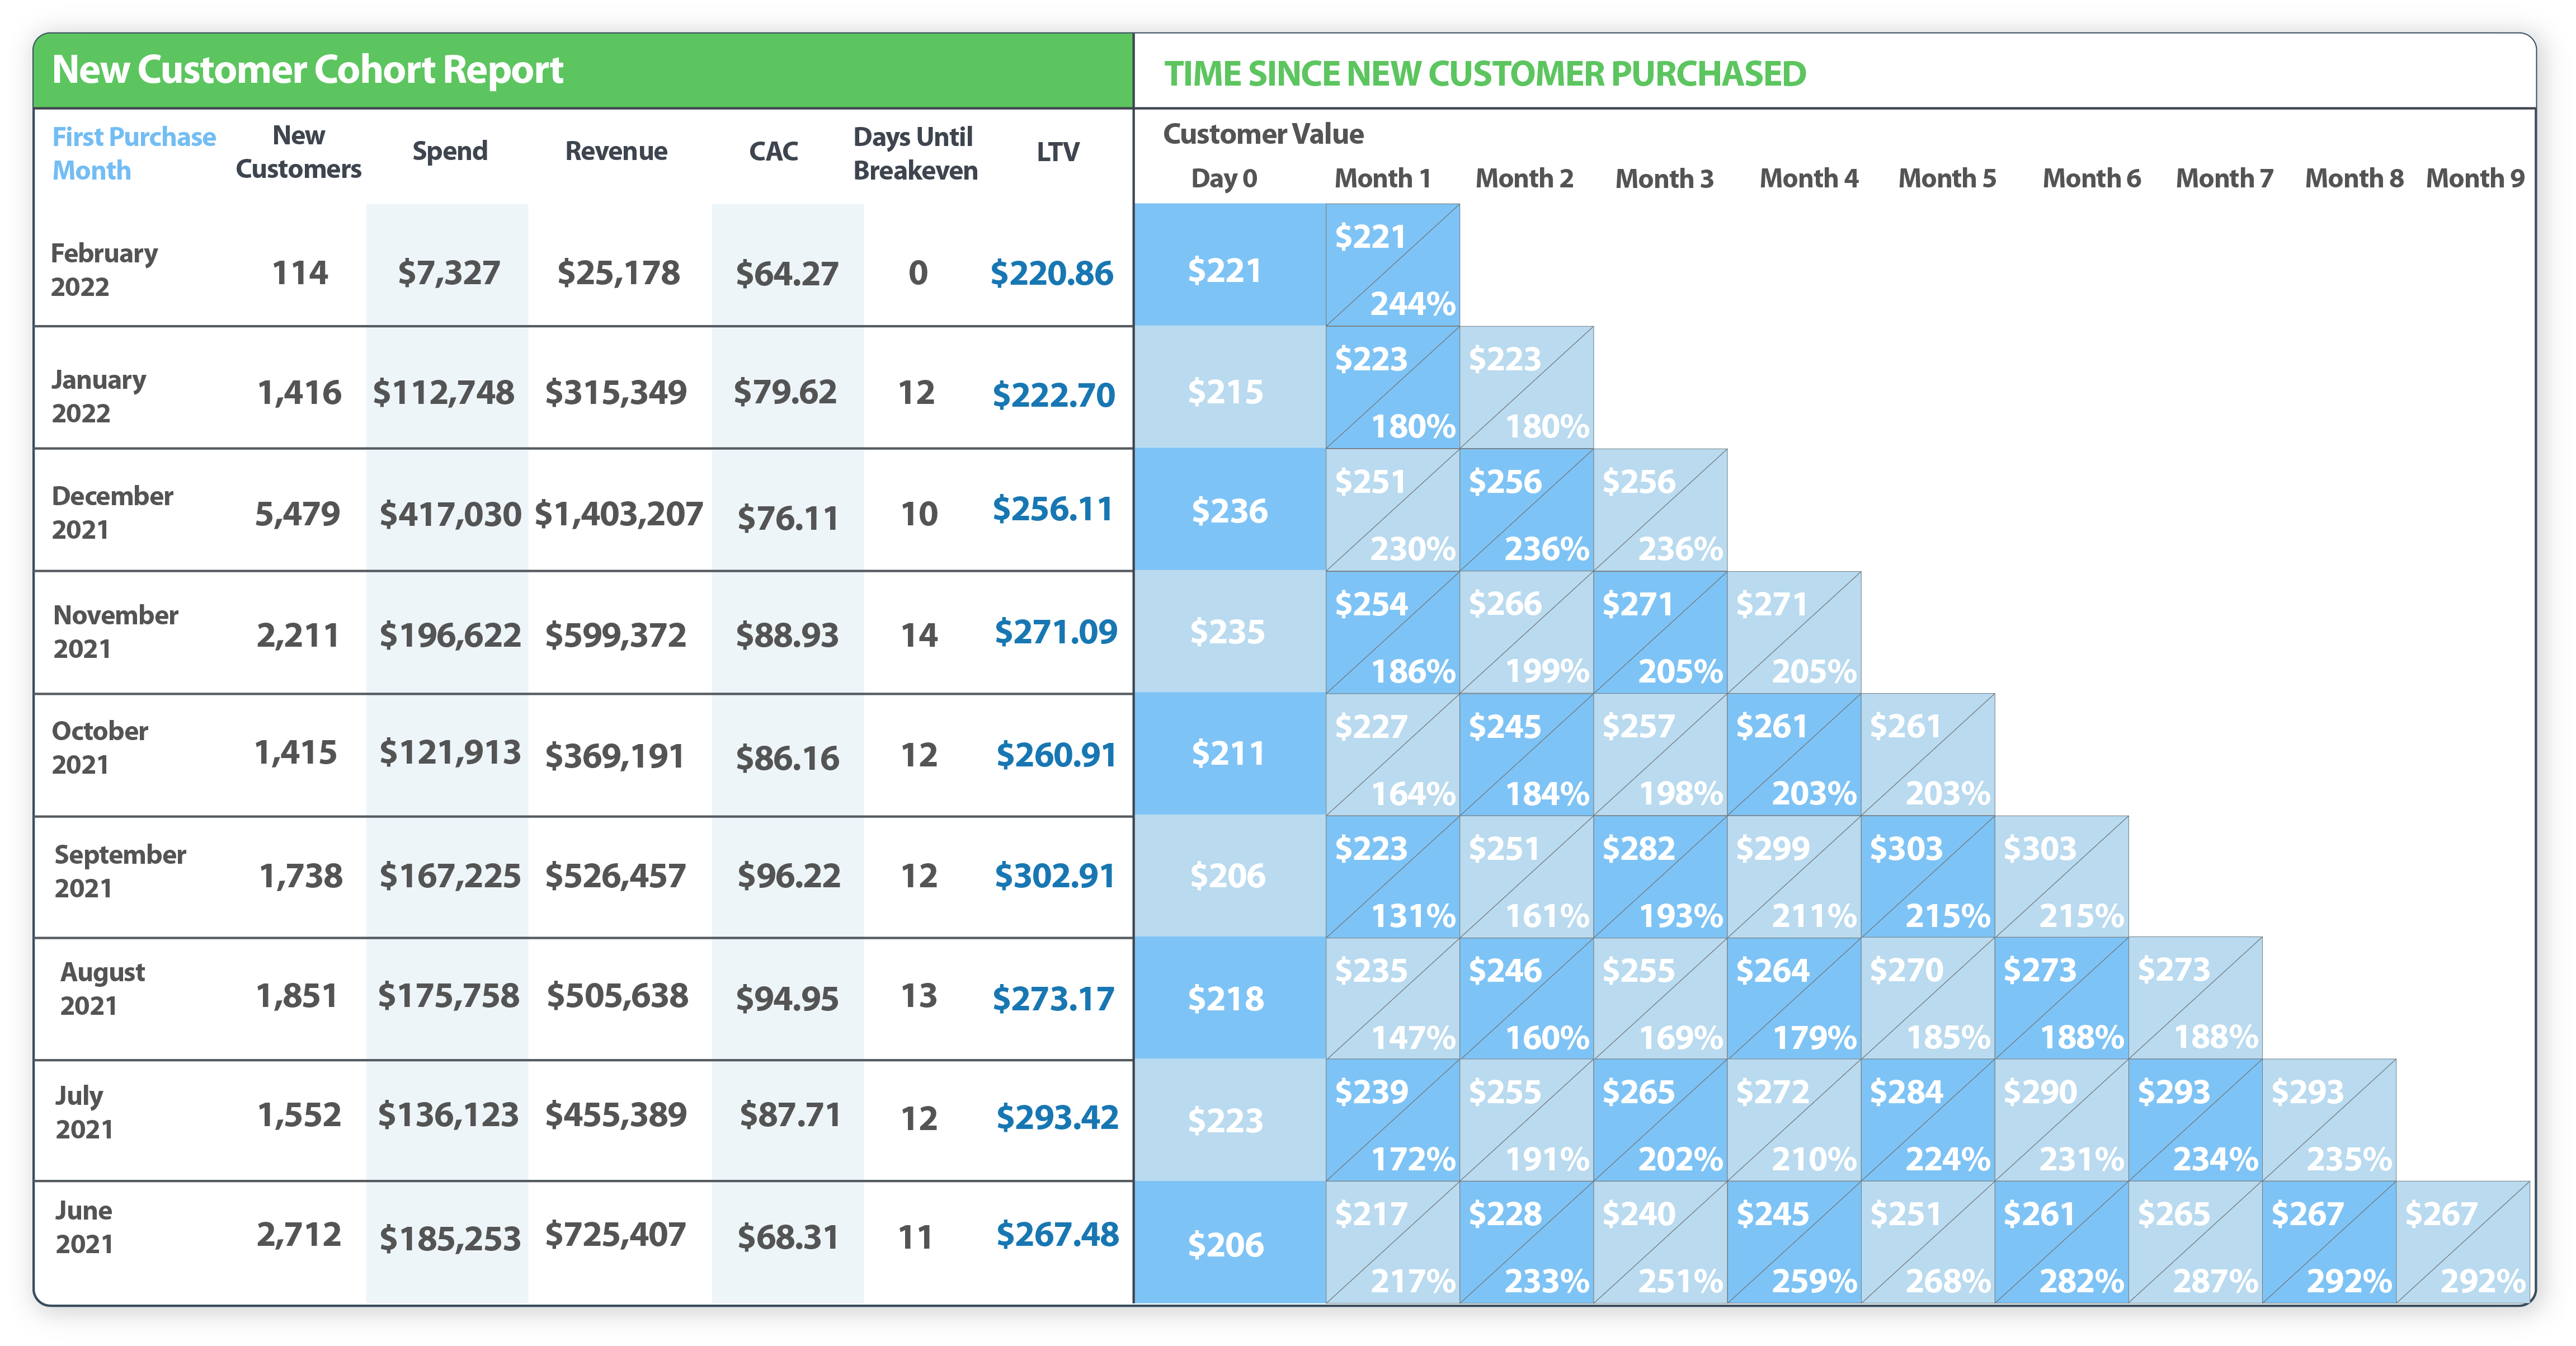
That's why Wicked Reports created the New Customer Cohort Report.

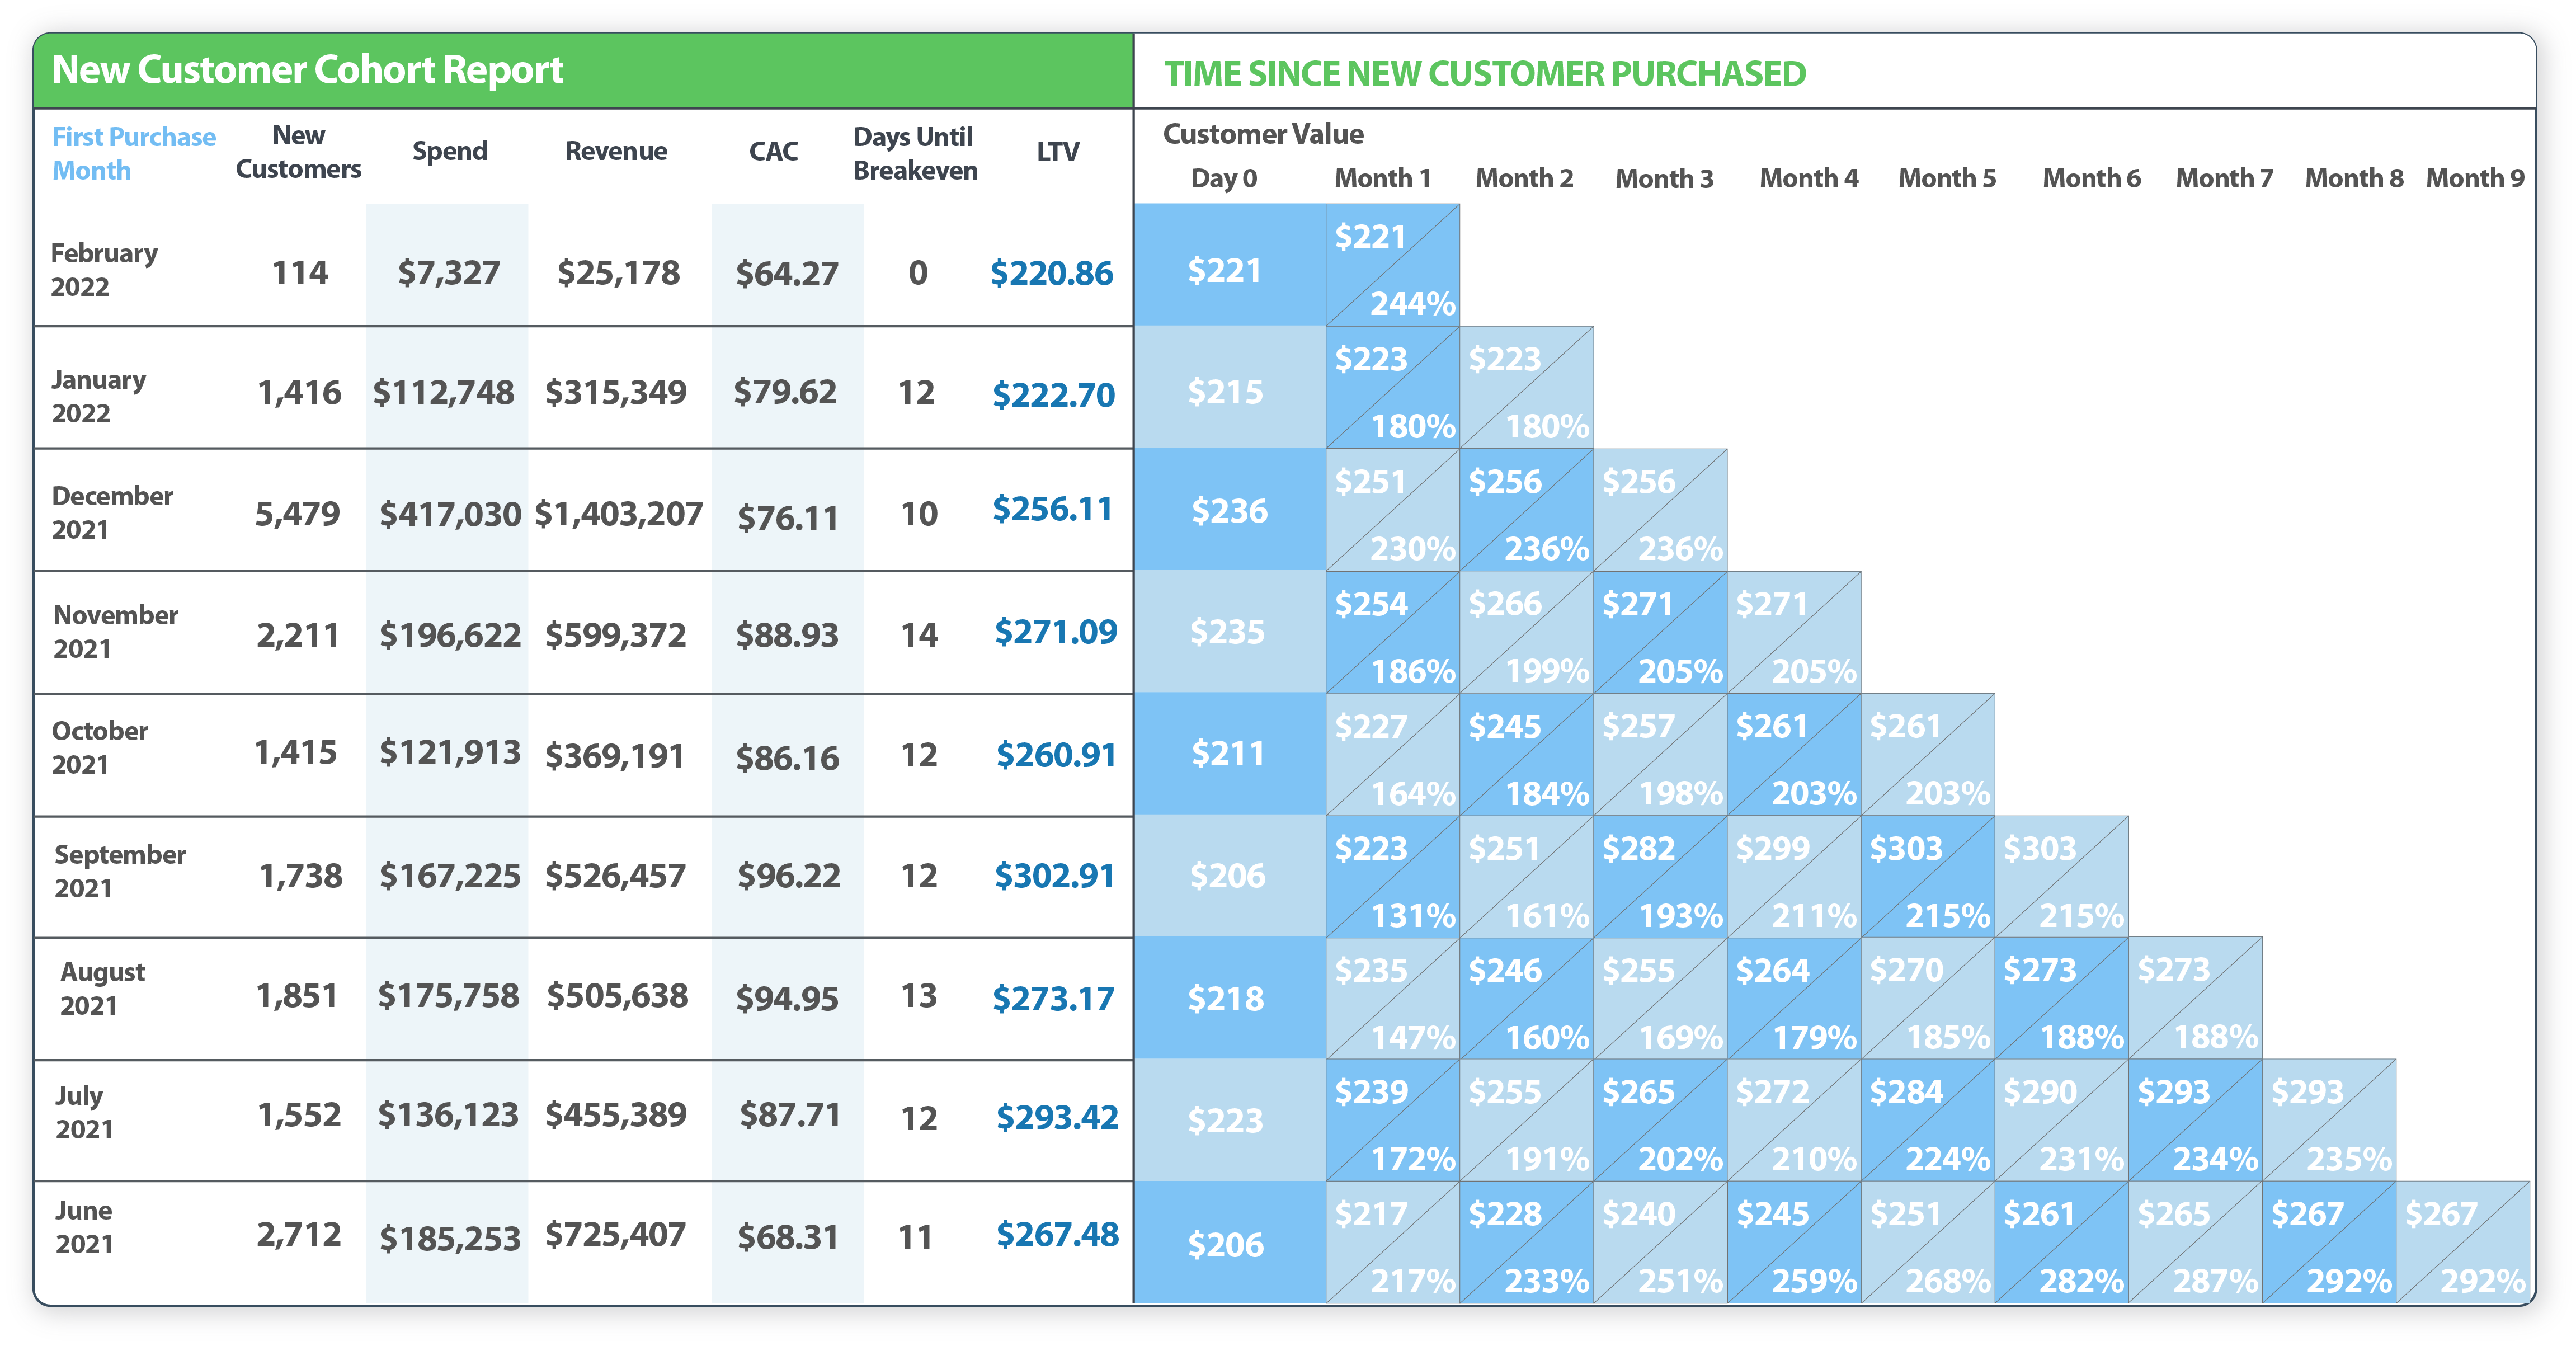
You can see in the report above how it's easy to track increasing LTV for customers each month. The higher the LTV, the more valuable customers you gained from ad campaigns in that month. As time goes by, the value of the customers increases.
For example, if you look at June 2021, on Day 0 the average new customer value was $206. This means the average new customer order size was $206. By 9 months later, the average LTV for customers acquired in June went up to $267 due to the number of repeat orders those customers made.
Compare that with September, where the average new customer value on Day 0 was exactly the same at $206. But, within only 5 months the average LTV for customers acquired in September shot up to $303, which is way higher than $261 which the September cohort reached in month 5.
What was different in September that brought in higher value customers? By evaluating, this Wicked client would be able to identify what advertising channels, audiences, or ad campaigns were bringing in the higher LTV customers and replicate those customer journeys.
This gives Wicked clients a huge advantage over competitors who are focused only on bringing in customers, not on targeting high LTV paid advertising.
How to Use Digital Marketing Metrics To Optimize Your Revenue
Digital marketing metrics used correctly can be a really profitable tool to increase revenue incrementally and strategically.
However, if your metrics are dependent on inaccurate data (like in Ad Manager), they are not going to be that useful for tracking results.
You can be confident that your data is accurate using Wicked Report's multi-touch marketing attribution dashboard. One less thing to get wrong in the equation!
Some tips to optimize your revenue:
- Balance cost and quality when choosing a CPL to shoot for.
- Let a new ad campaign run at least one buying cycle before you make a decision to kill, chill, or scale it.
- Focus on high LTV customers throughout your marketing funnel.
We recommend focusing on bringing in high LTV customers right from the cold traffic level, instead of waiting until middle of funnel to build those higher value audiences. This is a powerful game changer!
Interested in getting your brand access to the powerful marketing metrics in the Wicked Reports Dashboard?
Book a demo call with our helpful team today!


